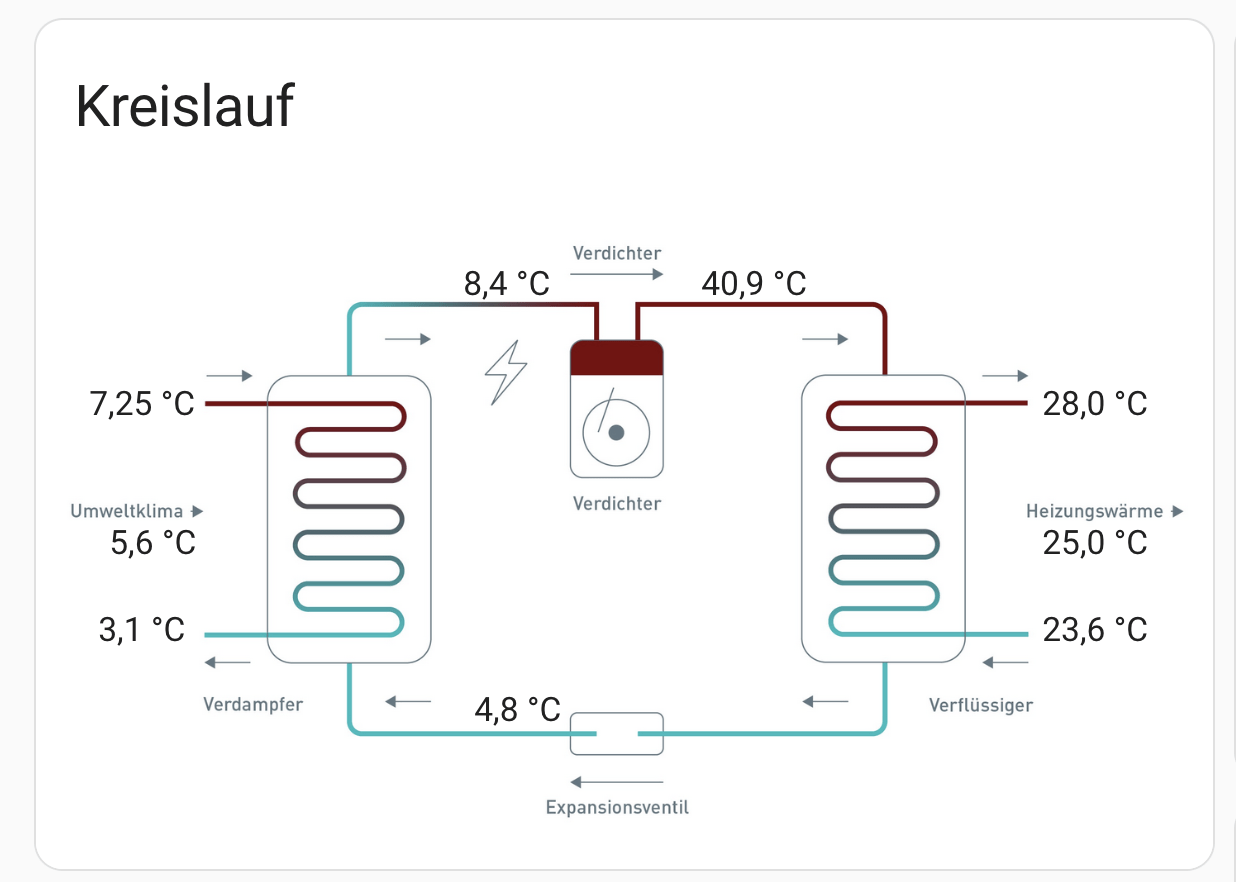
Eine Live-Anzeige des Wärmepumpen-Kreislaufes in Home Assistant:

Die Messwerte kommen über den eBusD und myPyllant aus der Vaillant ArothermPlus. Das Wärmekreislauf-Bild kann man als Picture Element einbinden, im Prinzip ist das nur ein Hintergrundbild. Und dann habe ich einfach die Temperaturen als State-Label Elemente darauf gelegt. Die Positionen der Temperaturen kann man sich über die Prozent-Angaben zurecht schieben.
Das Hintergrund-Bild kann Home Assistant selber hosten. Nach Anleitung lässt sich das integrierte Hosting aktivieren. Das SSH-Addon hat SCP-Support, damit kann man dann das Bild auf den Home Assistant raufschieben:
scp wp.png benutzer@192.168.0.999:/root/config/www/wp.png
Danach muss man HA einmal durchstarten.
Wenn man die State-Label (die Temperaturen) anklickt, bekommt man sogar noch die Detail-Seite zu dem jeweiligen Sensor angezeigt:

So sieht das im Home Assistant Editor dann aus:
type: picture-elements
title: Kreislauf
image: http://192.168.0.999:8123/local/wp.png
elements:
  - type: state-label
    entity: sensor.outdoor_temperature
    style:
      top: 51%
      left: 10%
  - type: state-label
    entity: sensor.arotherm_hmu00_airintaketemp
    style:
      top: 30%
      left: 9%
  - type: state-label
    entity: sensor.arotherm_hmu00_compressorinlettemp_temps2
    style:
      top: 12%
      left: 40%
  - type: state-label
    entity: sensor.arotherm_hmu00_compressoroutlettemp_temps2
    style:
      top: 12%
      left: 61%
  - type: state-label
    entity: sensor.arotherm_hmu00_condensationtemp_temps2
    style:
      top: 30%
      left: 90%
  - type: state-label
    entity: sensor.arotherm_hmu00_setmode_flowtempdesired
    style:
      top: 51%
      left: 90%
  - type: state-label
    entity: sensor.arotherm_hmu00_condensoroutlettemp_temps2
    style:
      top: 64%
      left: 90%
  - type: state-label
    entity: sensor.arotherm_hmu00_electronicexpansionvalveoutlettemp_temps2
    style:
      top: 76%
      left: 41%
  - type: state-label
    entity: sensor.arotherm_hmu00_evaporationtemp_temps2
    style:
      top: 64%
      left: 9%

